This project was for a Design Methods paper at University. This mapping was made based on an IDEO method of affinity diagrams which offers a way to analyze and interpret information. Clustering design elements according to relationships such as proximity, or dependence, allows for the discovery of insights about particular environments and identifies problems or opportunities.
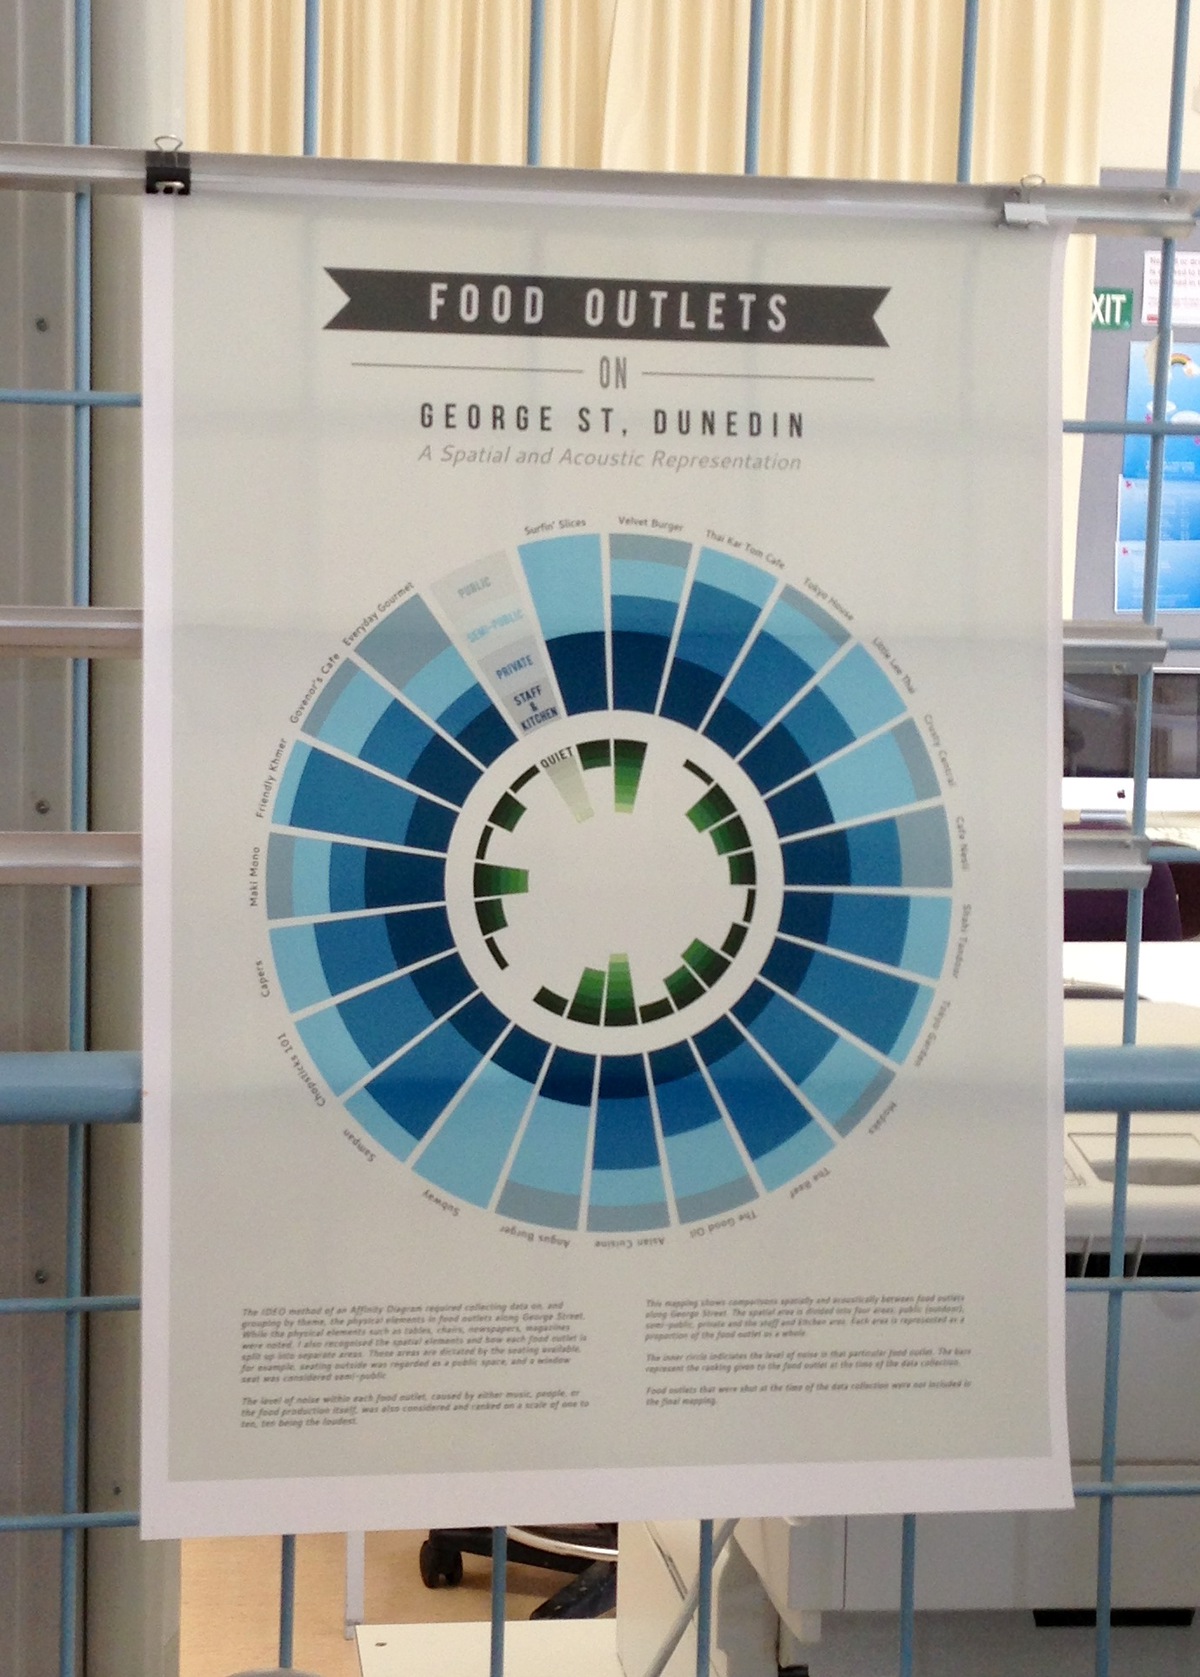
This mapping shows comparisons spatially and acoustically between food outlets along George St., Dunedin. The spatial area is divided into four areas; public (outdoor), semi-public, private and the staff and kitchen area. Each area is represented as a proportion of the food outlet as a whole.
The inner circle indicated the level of noise in that particular food outlet. The bars represent the ranking given to the food outlet at the time of data collection.

I collected data on, and grouped by theme, the physical elements in food outlets along George St, Dunedin. While physical elements such as tables, chairs, newspapers, magazines were recorded, I also recognised the spatial elements and how each food outlet was split up into separate areas. These areas were dictated by the seating available, e.g. seating outside was regarded as public space, and a window seat was considered semi-public. Mapping spatial elements in this manner this may lead to an understanding of how seating within a food outlet may influence human actions within that space.
The level of noise within each food outlet, caused by either music, people, or the food production itself, was considered and ranked on a scale of one to ten, ten being the loudest.
The level of noise within each food outlet, caused by either music, people, or the food production itself, was considered and ranked on a scale of one to ten, ten being the loudest.